Access Podman Desktop logs
When you face any connection issues or any other problems with your task execution, you can access the Podman Desktop logs to troubleshoot. In addition, you can also resolve those issues using the Repair & Connections and Stores tabs.
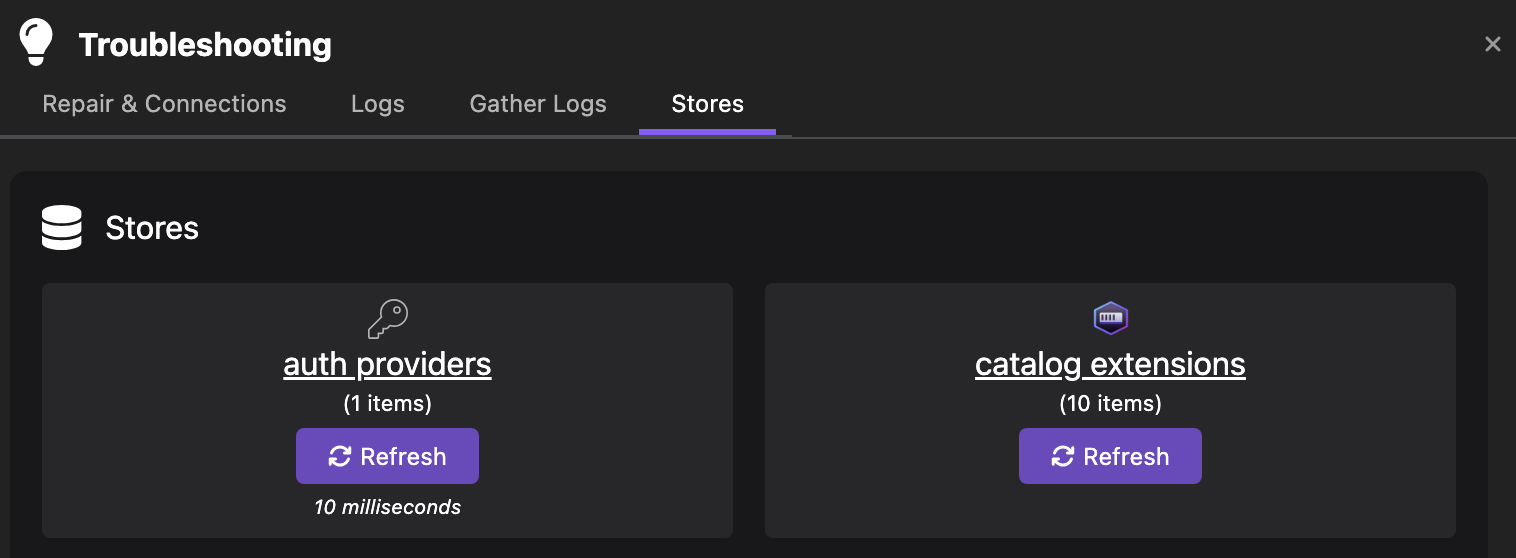
Stores denote the front-end objects that capture the event logs from the back-end side. For example, if a container is missing from the Containers component page, click the containers store link to check the event that triggered the last refresh. After comparing the number of containers in the store with those on the Containers page, you can identify whether a recent event is captured. If not, use the Refresh button to refresh the store data.
If you do not want to track the previous event logs, you can remove them from the history of the store.
Procedure: Access and save logs
- Click the Troubleshooting icon in the status bar.
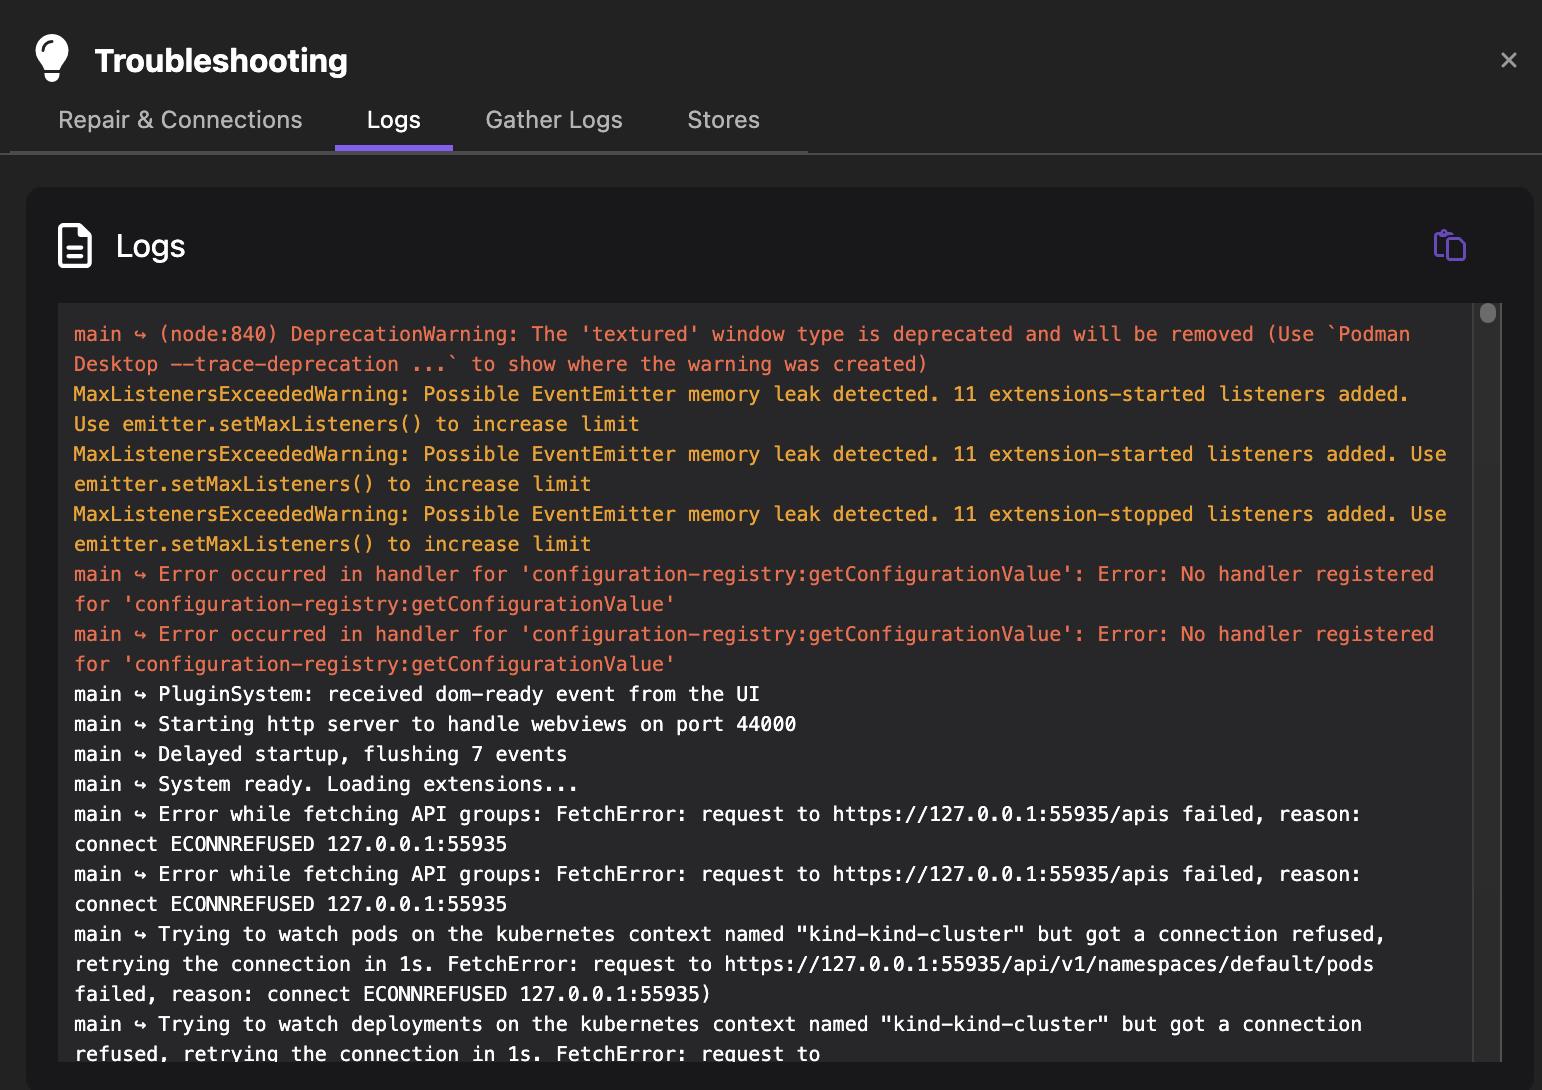
- Select the Logs tab to view the logs.

- Optional: Select the Gather Logs tab to save all the logs into a .zip file.
- Click collect and save logs as .zip.
- Browse the location where you want to save the logs.
- Click Save. You get a successful operation notification.
Procedure: Resolve connection issues
- Click the Troubleshooting icon in the status bar.
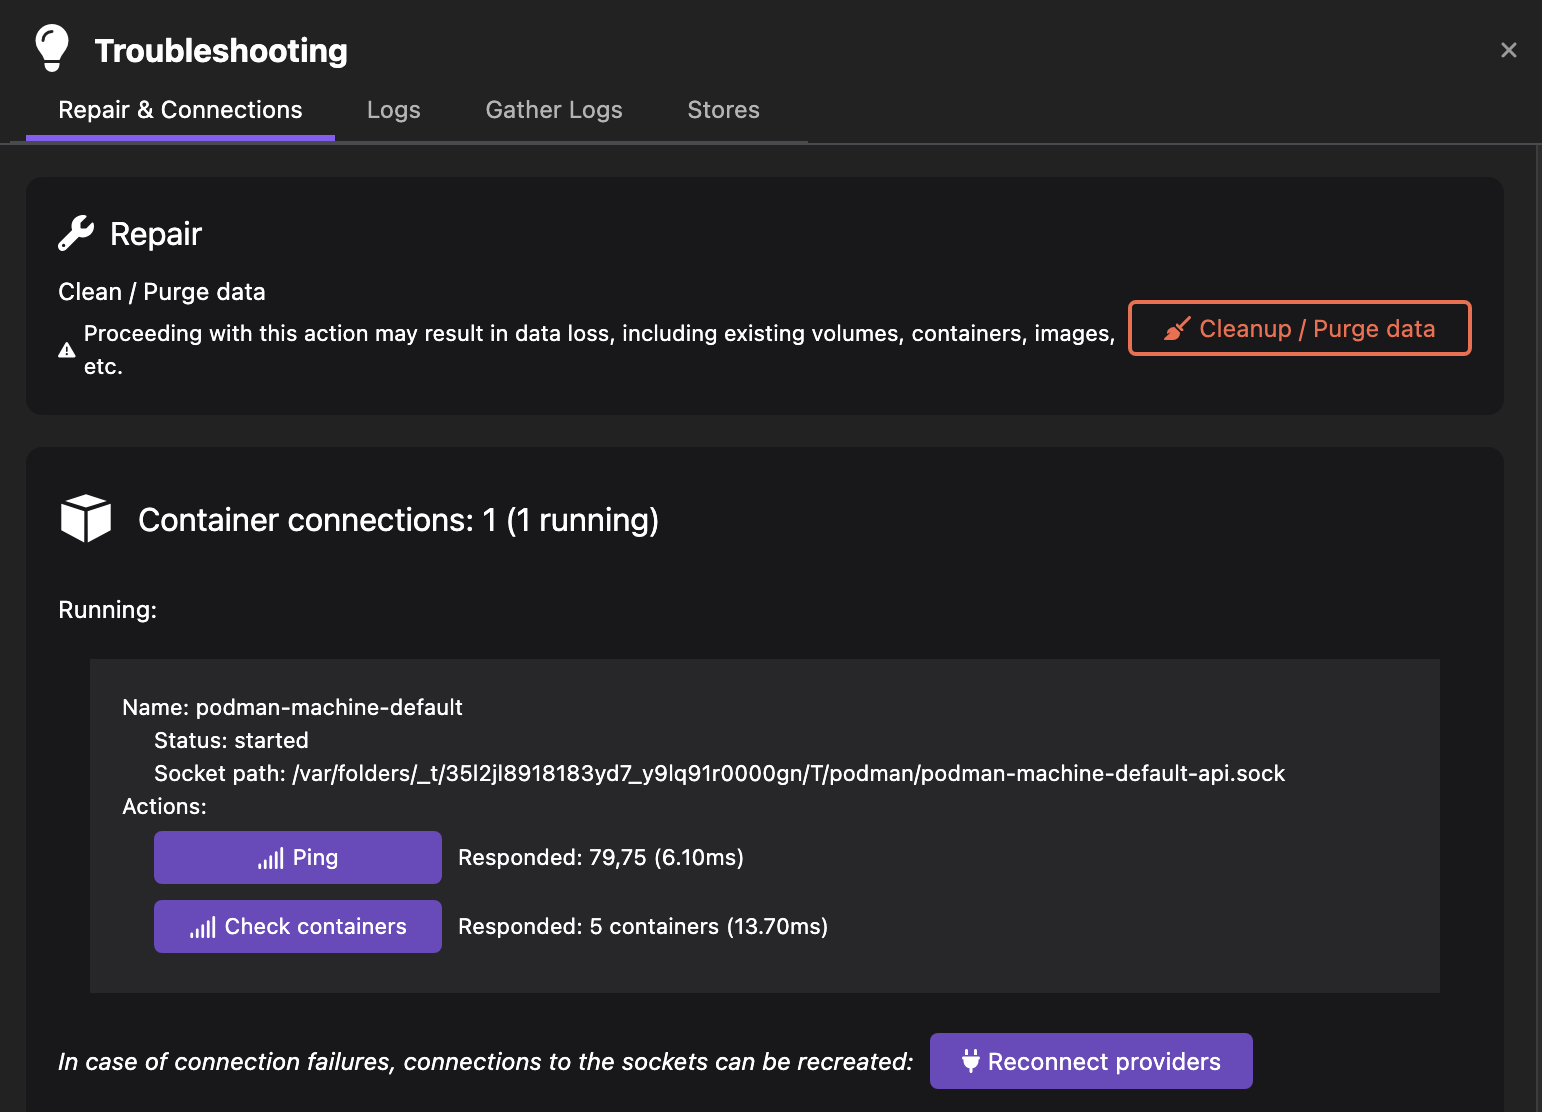
- Optional: Click Cleanup/Purge data to delete all resources from the engine.

- Optional: Check container connections:
- Click Ping to view the response time of the container engine.
- Click Check containers to view the response time of the available containers.
- Optional: Click Reconnect Providers to reconnect to the container engine socket.
Procedure: Resolve event-related issues
- Click the Troubleshooting icon in the status bar.
- Select the Stores tab to view the stores associated with Podman Desktop.

- Click a store link.
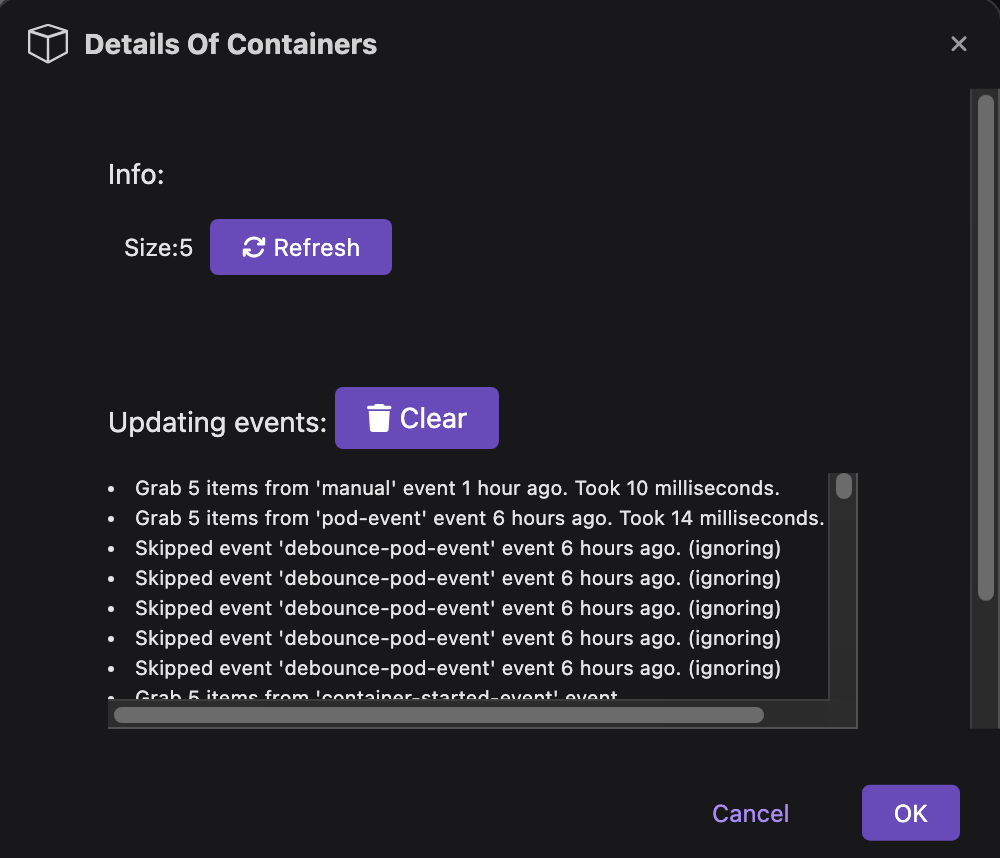
- Click Refresh to refresh the event logs.

- Optional: Click Clear to delete the event logs.
- Click OK.